CPU events
The Chombit microprocessor temporarily preempts its operation to handle various types of CPU events:
-
CPU traps are triggered by assembly language instructions
fail,trace, orrequest. -
CPU faults are triggered when an invalid operation occurs such as overflowing the stack or attempting to access a nonexistent memory address.
In the future, Chombit may also add support for another CPU event type called a hardware interrupt. Unlike traps and faults, which get processed immediately, interrupts are triggered asynchronously. For example, if the program is busy handling another event, the interrupt handler may not get triggered immediately. When it finally runs, it may need to process multiple events that accumulated in the interim. The Chombit CPU avoids this complexity by interacting with devices using memory-mapped input/output (MMIO) designed to eliminate the need for interrupts. Thus, this feature would only be necessary for advanced problems such as multithreading or certain video effects.
The table below summarizes the CPU events currently implemented by Chombit:
| Handler | CPU event | cpu_event_value |
|---|---|---|
io::cpu_fail_handler | fail <operand> | <operand> |
io::cpu_fail_handler | Invalid instruction fault | 0 |
io::cpu_fail_handler | fail if overflow | 1 |
io::cpu_fail_handler | fail if carry | 2 |
io::cpu_fail_handler | fail if null | 3 |
io::cpu_fail_handler | Null address fault | 4 |
io::cpu_fail_handler | Read-only fault | 5 |
io::cpu_fail_handler | Invalid address fault | 6 |
io::cpu_fail_handler | Stack fault | 7 |
io::cpu_trace_handler | trace <operand> | <operand> |
io::cpu_trace_handler | trace | 0 |
io::cpu_request_handler | request <operand> | <operand> |
The Chombit microprocessor responds to these events by temporarily jumping to one of the three event handlers that perform some action. Afterwards, the handler may optionally restore the CPU state and resume executing the original program.
Failure codes
The io::cpu_fail_handler is triggered by a fail instruction or a CPU fault. Typically, the handler will terminate the program, displaying an error message. The table below summarizes the standard interpretation of the io::cpu_event_value input for an io::cpu_fail_handler implementor.
| Failure code | Meaning |
|---|---|
| 0 – 15 | Reserved by the Chombit hardware. |
| 0 | Invalid instruction fault: The IP points to an invalid opcode.Example: Chombit CPU fault: Invalid instruction at $xxxx_xxxx |
| 1 | "Numeric overflow; the result does not fit in the register" Reported by fail if overflow. |
| 2 | "Unsigned overflow; the result does not fit in the register" Reported by fail if carry. |
| 3 | "Accessed a null pointer" Reported by fail if null. |
| 4 | Null address fault: The address bus tried to dereference a null pointer.Example: Chombit CPU fault: Accessed a null memory address |
| 5 | Read-only fault: The address bus tried to write to read-only memory.Example: Chombit CPU fault: Cannot write to read-only address $xxxx_xxxx |
| 6 | Invalid address fault: The address bus tried to access a memory address that does not exist.Example: Chombit CPU fault: Accessed an invalid memory address $xxxx_xxxx |
| 7 | Stack fault: The sp register became larger than the gp register. This detection is performed only if io::stack_guard is 1, and only for push, gpush, and add sp instructions.Example: Chombit CPU fault: Stack overflow |
| 16 – 31 | Reserved for usage by the Hybrix compiler and framework. |
| 16 | "The main::start() function has returned" |
| 17 | "There is not enough memory to create this object" |
| 18 | "Heap memory corruption detected" |
| 19 | "Array index out of bounds" |
| 20 | "Function was called with an invalid argument" |
| 32 – 255 | Custom codes available for the user's program. |
| ≥256 | Values larger than 255 will be interpreted as a memory address containing a custom text string to display. |
The fail cat
The Hybrix framework's default implementation of io::cpu_fail_handler displays a "fail cat", then terminates the program by entering an infinite loop.
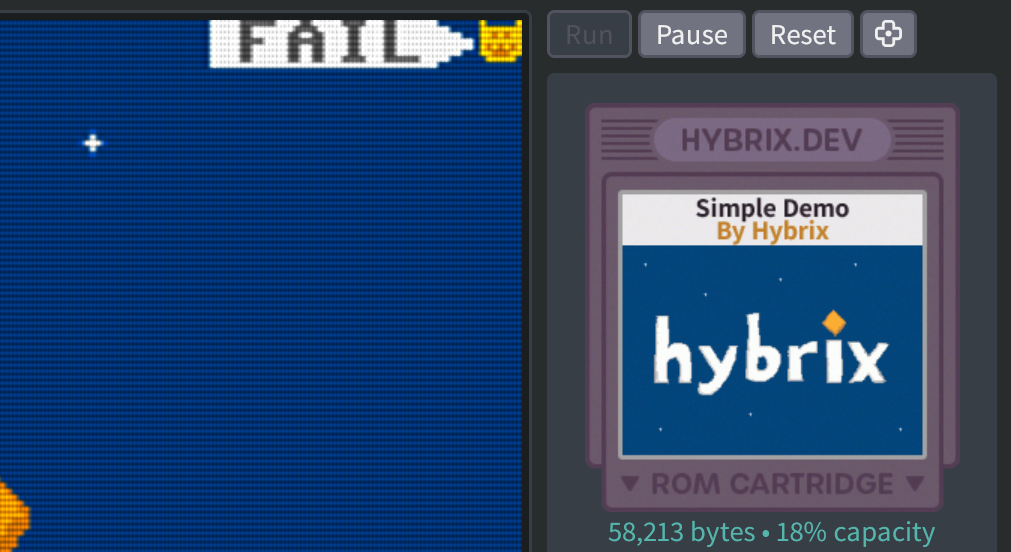
The "fail cat" indicates a kernel failure
The fail cat may not appear correctly unless console::init() has been called to prepare kernel::console_grid with a suitable font.
Trace IDs
The trace instruction prints a diagnostic message to the Hybrix debugger log. The table below summarizes the standard interpretation of the io::cpu_event_value input for an io::cpu_trace_handler implementor.
| Trace ID | Meaning |
|---|---|
| 0 | Reported by trace without an operand. |
| 1 – 239 | Custom IDs available for the user's program. |
| 240 – 255 | Reserved for usage by the Hybrix framework. |
| 254 | Reported during a manual garbage collection, immediately before the "mark" operation. |
| 255 | Reported during an automatically triggered garbage collection, immediately before the "mark" operation. |
| ≥256 | Values larger than 255 will be interpreted as a memory address containing a custom text string to display. |
Request numbers
The request instruction is used to request special actions from the system environment. If the Hybrix debugger or virtual machine does not process a request, then control passes to the io::cpu_request_handler code. The Hybrix framework's default implementation ignores request number 0 (Break); beyond that, it does not contribute any additional request functions. Instead, it simply reports a failure.
| Request number | Function |
|---|---|
| 0 – 15 | Reserved for usage by the Hybrix virtual machine and development environment. |
| 0 | Break Pause your program in the debugger. This is used to implement the Hybrix break statement. |
| 1 | GC sweep Invokes the debugger's garbage collector to perform a "sweep" operation. |
| 2 | GC mark Invokes the debugger's garbage collector to perform a "mark" operation. |
| 16 – 255 | Available for usage by a custom kernel. Useful for advanced programs such as an operating system or software debugger. |
I/O definitions
module io
  . . .
  # Custom handling for "fail", "trace", "request" and other CPU events
  var cpu_event_flags: byte                  located at $d0_0013
  var cpu_event_ip: int                      located at $d0_0014
  var cpu_event_fp: int                      located at $d0_0018
  var cpu_event_value: int                   located at $d0_001c
  var cpu_fail_handler: int                  located at $d0_0020
  var cpu_trace_handler: int                 located at $d0_0024
  var cpu_request_handler: int               located at $d0_0028
  . . .
end module